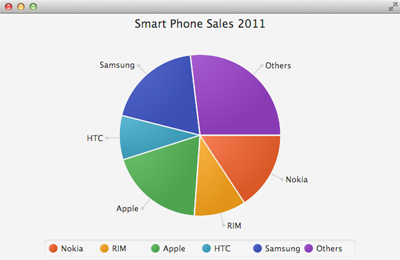
JavaFX includes an extensive Chart package with eight different charts to visualize data. Seven of these are XY-type charts that plot data in a grid, such as a line chart and bar chart. The eighth chart is a pie chart, which is suitable for visualizing market share data and displays the relative percentage of a whole.
JavaFX charts are rendered as nodes in the scene graph. This means you can apply effects and add animations to the charts. JavaFX charts store their data in observable lists. When the data changes, the chart automatically re-renders itself using animation to adjust the plotted graphics. With a pie chart, the pie wedges grow and shrink to their new sizes using animation. Although this is the default behavior, you can turn off the animated changes with method setAnimated(false).
Let’s show you a simple example of a pie chart using smart cell phone sales data for 2011. We show the top five companies and a sixth category representing others. First, here is the data is table form.
Company             Units Sold in Millions
Nokia                     77.3
ResearchInMotion          51.1
Apple                     93.2
HTC                       43.5
Samsung                   94.0
Others                   132.2
And here’s the JavaFX pie chart visualizing this data.
In keeping with our preference for using FXML, we create a JavaFX FXML application. Here is the fxml to place a PieChart centered in a StackPane layout control. Note that PieChartController is the FXML controller class.
<StackPane id="StackPane" prefHeight="400" prefWidth="650"
           xmlns:fx="http://javafx.com/fxml/1"
           fx:controller="piechart.PieChartController">
    <children>
        <PieChart fx:id="chart"  />
    </children>
</StackPane>
An observable list of type PieChart.Data stores the PieChart data. Each data item includes a name and pieValue. Here’s the code to initialize the pie chart with the above data, which we add to the PieChartController class in the controller’s initialize() method. Recall that the FXML loader instantiates the objects defined in the FXML file and the @FXML annotation lets you access these from the controller.
public class PieChartController implements Initializable {

    @FXML
    private PieChart chart;
    private ObservableList<PieChart.Data> pcData;

    @Override
    public void initialize(URL url, ResourceBundle rb) {
        // Create the observable list and add the data
        pcData = FXCollections.observableArrayList();
        pcData.add(new PieChart.Data("Nokia", 77.3));
        pcData.add(new PieChart.Data("RIM", 51.1));
        pcData.add(new PieChart.Data("Apple", 93.2));
        pcData.add(new PieChart.Data("HTC", 43.5));
        pcData.add(new PieChart.Data("Samsung", 94.0));
        pcData.add(new PieChart.Data("Others", 132.3));
        chart.setData(pcData);
        chart.setTitle("Smart Phone Sales 2011");
        pcData.stream().forEach(pieData -> {
            System.out.println(pieData.getName() + ": "
            + pieData.getPieValue());
        });
    }
}
After initializing the data, we print the names and values to the console using the stream and forEach functional operations in a lambda construct.
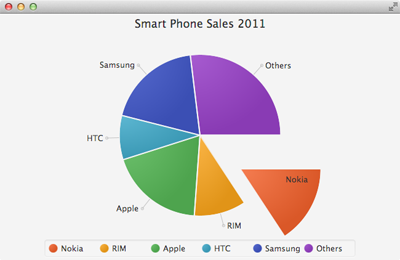
Now let’s add a mouse click event handler to animate an individual pie wedge outward, as shown in the following screen shots. Figure 2 shows the animated Nokia wedge.
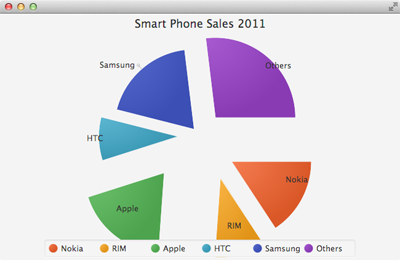
And Figure 3 shows a frenzy of animated wedges with multiple mouse clicks!
We can add this animation by accessing the JavaFX scene graph node associated with each PieChart.Data element. A translate transition provides the animation we want. The wedge returns to its original position when we set cycle count to 2 and auto reverse to true. The setByX() and setByY() methods indicate the change to the X and Y positions. We just need to determine the byX and byY values to use. Here’s the code to access each pie chart wedge and add a mouse click event handler to its node.
    pcData.stream().forEach(pieData -> {
        pieData.getNode().addEventHandler(MouseEvent.MOUSE_CLICKED, event -> {
            Bounds b1 = pieData.getNode().getBoundsInLocal();
            double newX = (b1.getWidth()) / 2 + b1.getMinX();
            double newY = (b1.getHeight()) / 2 + b1.getMinY();
            // Make sure pie wedge location is reset
            pieData.getNode().setTranslateX(0);
            pieData.getNode().setTranslateY(0);
            TranslateTransition tt = new TranslateTransition(
                    Duration.millis(1500), pieData.getNode());
            tt.setByX(newX);
            tt.setByY(newY);
            tt.setAutoReverse(true);
            tt.setCycleCount(2);
            tt.play();
        });
    });
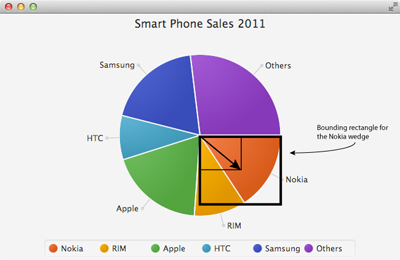
The Node method getBoundsInLocal() returns the node’s rectangular bounding information (line 3). To show you what the bounds in local looks like, we add a rectangle to the scene with the height and width set to the node’s bounding rectangle, as shown in Figure 4 for the Nokia wedge. (Since we’re using a StackPane layout here, the rectangle is centered over the pie chart and we move the rectangle off center by adjusting its translateX and translateY positions.)
The wedge needs to move to the center of its bounding rectangle (indicated by the arrow). So, the new X is half its width added to its current minimum X position (line 4). Likewise, the new Y is half its height added to its minimum Y position (line 5). (These values may be negative depending on the orientation of the wedge.) Remember, the origin of the JavaFX coordinate system is the upper left, where X values increase to the right and Y values increase down the screen. The getBoundsInLocal() method returns values relative to the local coordinate system of its node.
You can download the complete PieChart.zip example here.
In our next post, we’ll show you how to add a simple in-place text editor to dynamically change pie wedge values.


